Solutions — SkillTrack

Measure skill change. Not just completion.

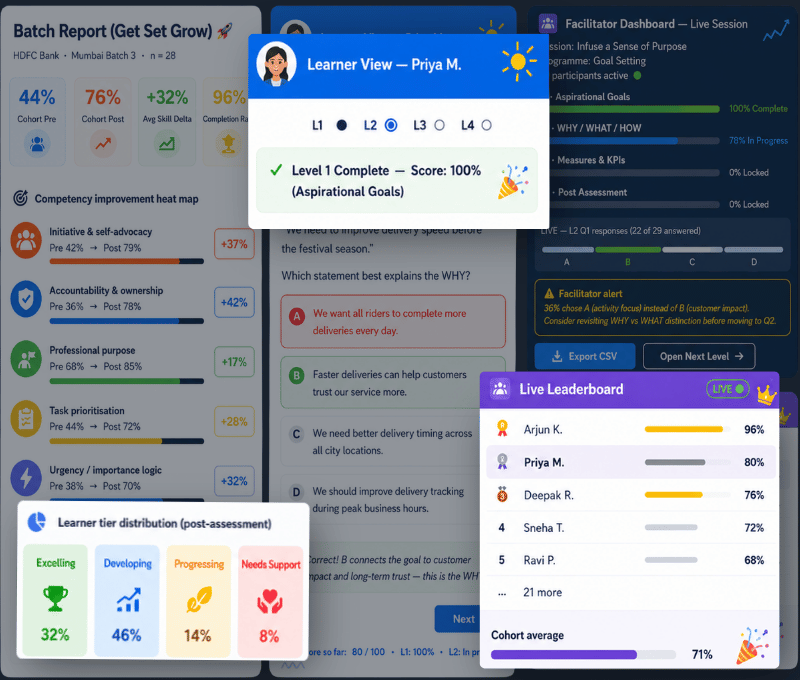
SkillTrack is the measurement and intelligence layer that wraps around every Skill Labs program. When Skills Café runs a development program, SkillTrack is the lab report that comes with it — converting gut feelings into numbers, stories, and decisions. After the program ends, L&D leaders are left with a certificate and a feeling. SkillTrack converts that feeling into a number, a story, and a decision point for what comes next.

Pre
Skill baseline
Post
Skill delta
90
Day transfer pulse
SkillTrack

The Problem Skills Café Already Lives Inside

Great programs. No proof of change.

L&D Head
"We ran the manager program for 300 people. Finance wants to know what changed. I have attendance data and happy sheets. That's it."
→ No budget renewal. Program gets cut.
CHRO
"We have 12 different manager cohorts across business units. I have no idea if any of them are actually building better managers."
→ Inconsistent manager quality. High attrition.
Program Manager
"I know the workshop went well — participants loved it. But 6 weeks later? I don't know if anything changed on the job."
→ Learning transfer problem. 70% of training forgotten.
Manager (Learner)
"I attended the program. I got a certificate. But I still don't know what I'm actually good at or what I need to work on."
→ No personal development direction. Engagement drops.

What SkillTrack Does

Four measurement layers. One complete picture.

SkillTrack is not a new standalone product—it is a measurement and intelligence layer that wraps around every Skill Labs program. All four measurement stages combine to deliver complete capability visibility: from baseline through real-time progress, post-program outcomes, and on-job application.
1
Pre-program skill baseline Before the program starts
Every participant completes the existing Benchmarking Pre (game-based assessment + AI role-play). SkillTrack processes these results into a structured skill score — not just a bar chart, but a normalised, comparable number for each competency. L&D heads get cohort readiness before Day 1, and can see where the organization is strong and where the gap sits. This makes the Benchmarking Pre more than a warm-up — it becomes the diagnostic that the whole program is measured against.
2
In-program signal collection During the program
SkillTrack collects behavioral signals throughout the program — from AI role-play quality scores, facilitated activity performance, retrieval practice accuracy, and nudge response rates. These are leading indicators of skill change. Unlike a post-survey, these signals are collected behaviorally and can't be gamed by someone who simply 'liked the workshop'. Facilitators input structured behavioral ratings from live facilitation, creating a real-time engagement index that shows whether the cohort is actually progressing.
3
Post-program skill score 4–8 weeks after
The same assessment format as the pre — game-based + AI role-play — repeated to measure actual change. SkillTrack calculates the skill delta: how much did each competency improve, for each person and the cohort overall. This is the deliverable the CHRO and Finance team have been asking for. You get individual Skill Track scores before vs. after, quantified improvements by competency, cohort skill reports showing which competencies moved most, and transfer risk flags identifying who learned in the program but may struggle to apply it back at the desk.
4
On-job transfer pulse 60–90 days after
A lightweight manager-rated behavioral observation, combined with a self-assessment and one AI coaching conversation. Measures whether the skill learned in the program is actually being applied on the job — or fading to the forgotten 70%. The manager investment is just 5 minutes for a structured behavioral rating. The learner reflects with specific examples. The AI coaching conversation takes 15 minutes and checks skill retention. You get a transfer score, see who applied the skill and who needs a booster, and create a new touchpoint for renewal or upsell conversations. This is the hardest problem in L&D — measuring transfer — now made feasible at scale.

Sample Output

What a SkillTrack report looks like.

This is what SkillTrack puts in the hands of learners, L&D leaders, and the CHRO. Based on the Manager Development Program context. At the end of Week 8, the Skill Track report is generated with individual delta cards, cohort reports, and benchmark comparisons—a PDF clients can share with Finance and the Board. This is the moment that wins the renewal and proves learning impact.

Manager Development Program — Cohort 3
SkillTrack Report · Q3 2025
Cohort Skill Delta
Coaching Conversations +1.8
Feedback Quality +1.4
Goal Setting +2.1
Delegation +0.9
Influence +1.2
Individual Sample
Priya Sharma
Manager, Operations · Cohort 3
Pre-score
Post-score
+2.2 overall skill delta
Strongest gain in coaching conversations (+2.8). Transfer risk flag on delegation — recommend follow-up nudge.

Let's talk

Ready to prove the impact of
your learning investments?

Every Skills Cafe program ships with SkillTrack — the measurement guarantee that turns learning ROI from hope into evidence.

Get in touch Request a proposal